
 0 saved
 20.8K views


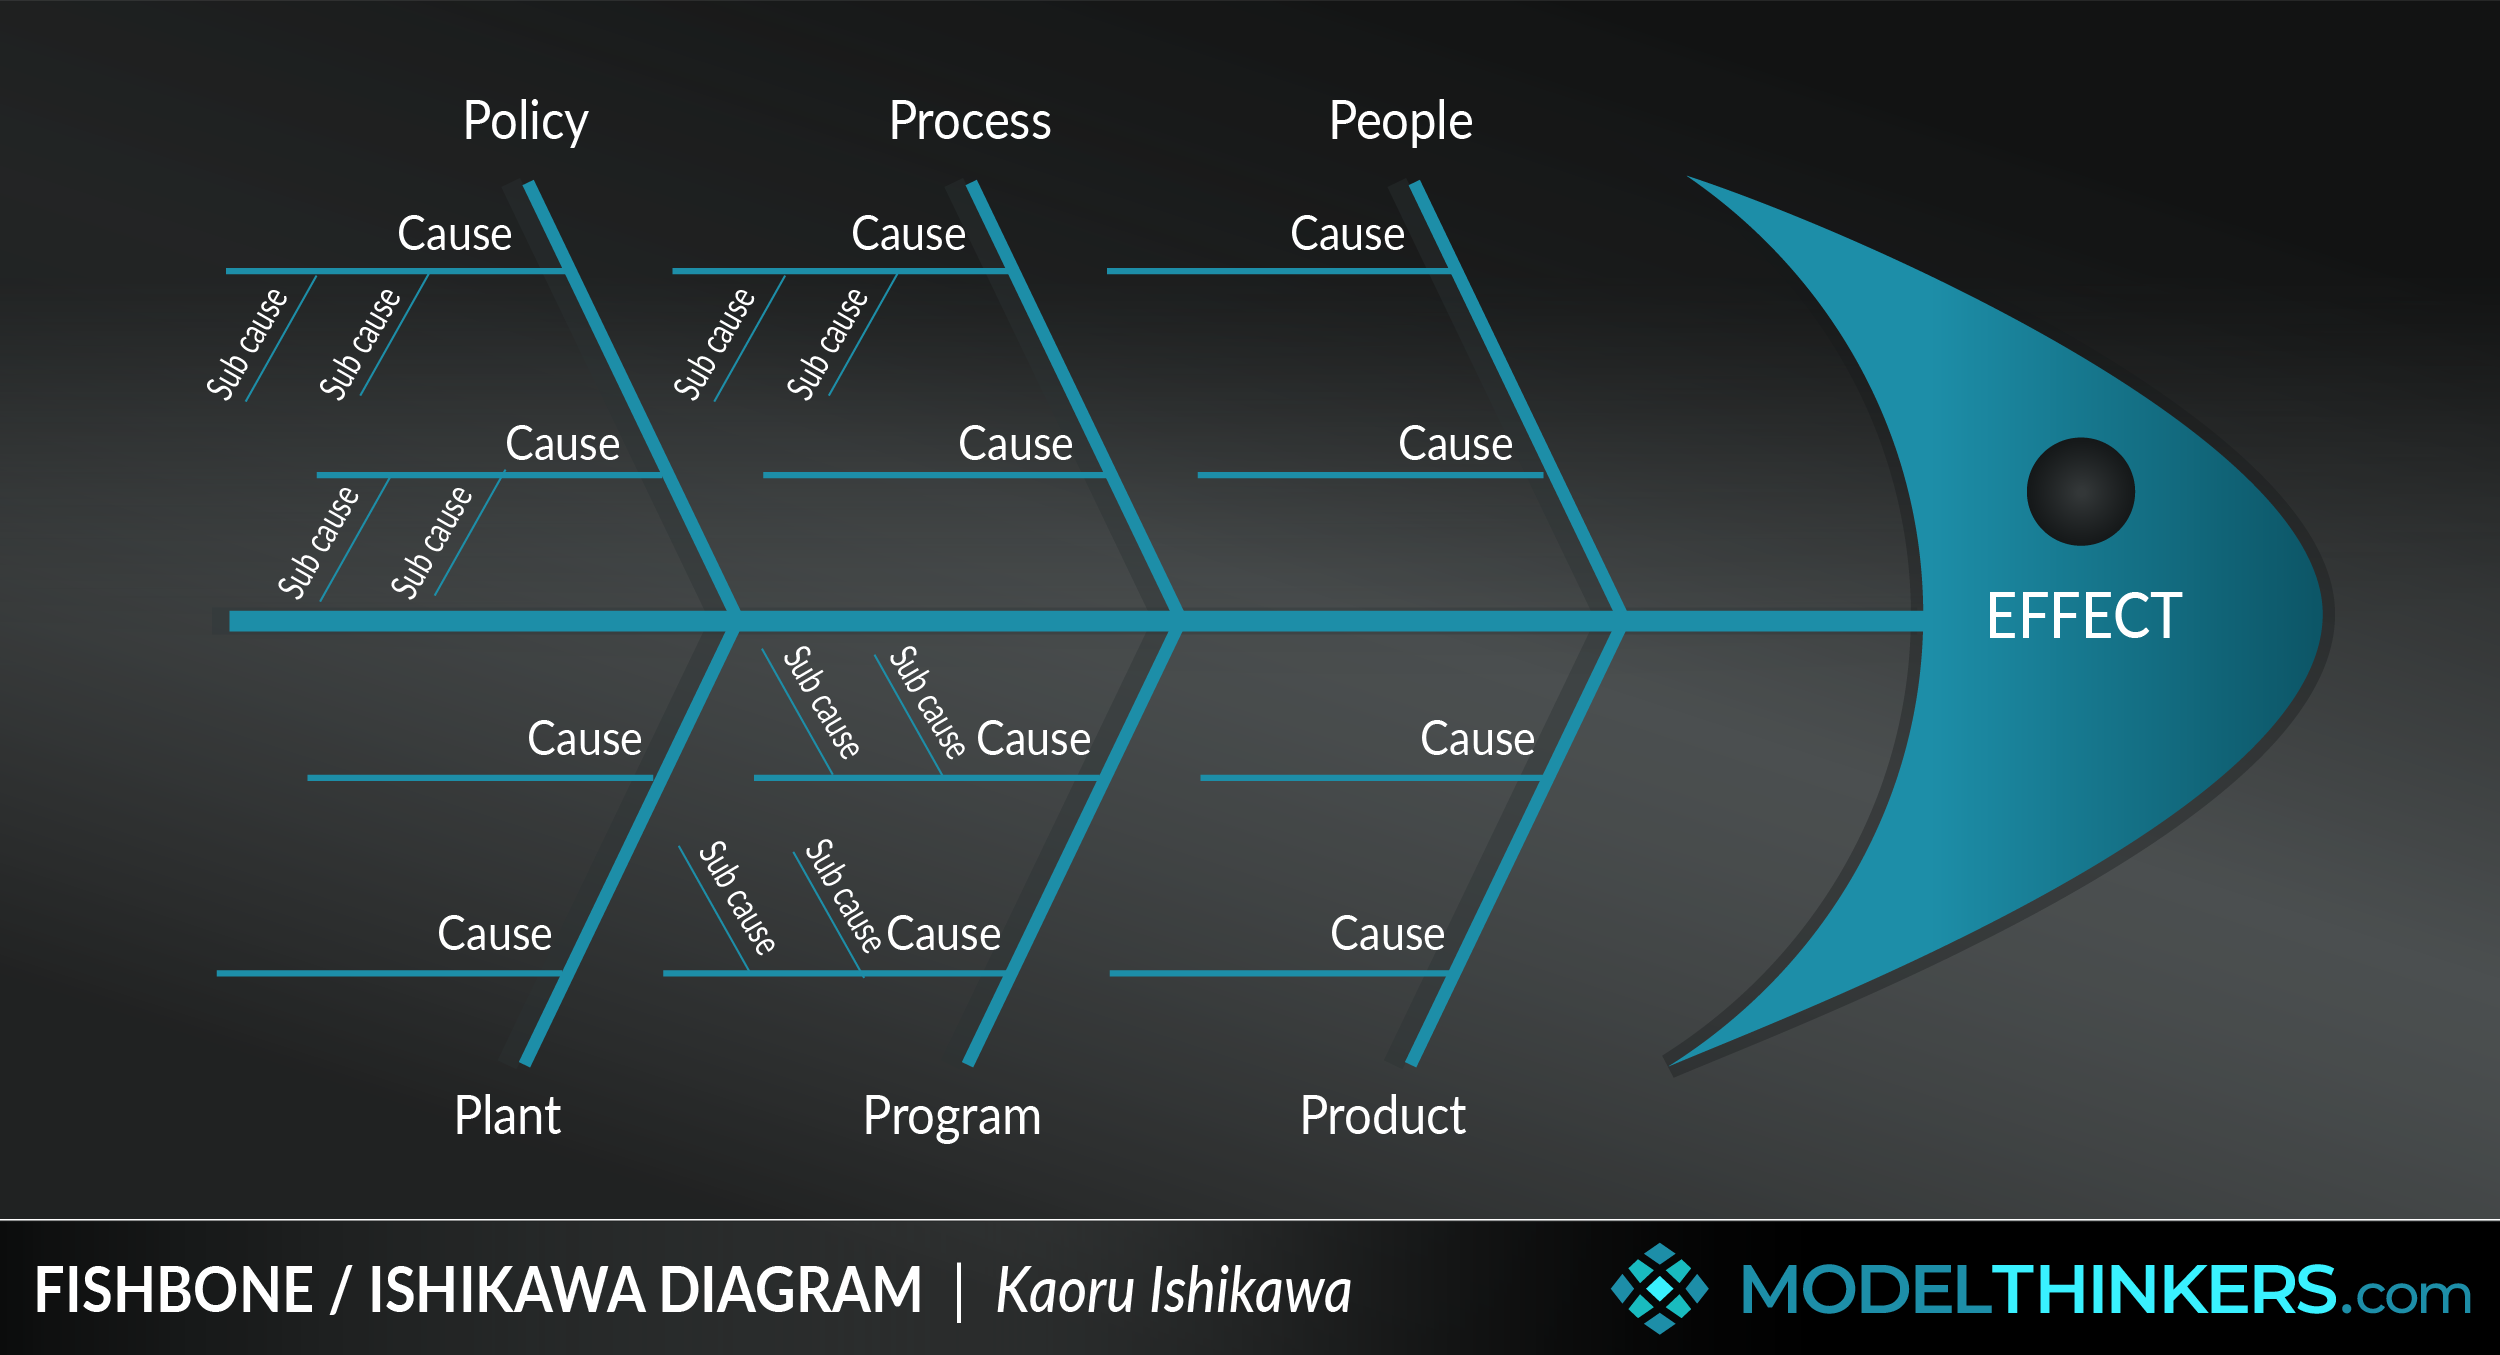
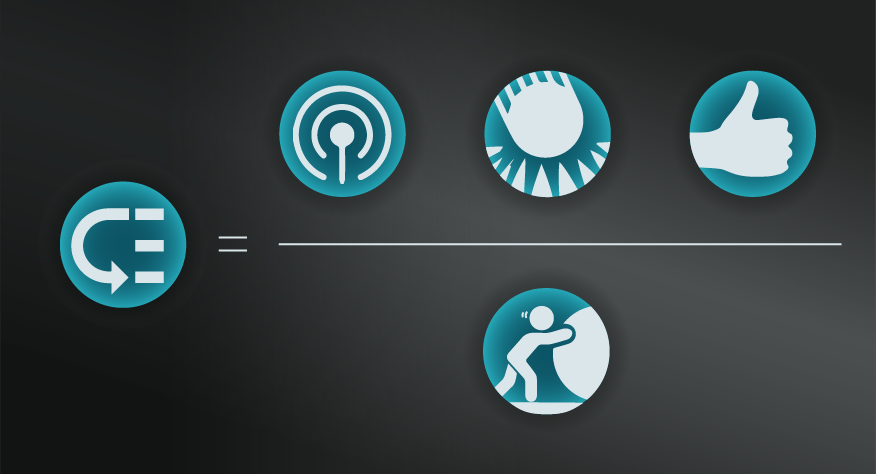
Track the reasons behind challenges and problems in any domain using this hierarchy based tool — bonus, it looks like a fish, what’s no ...
Lorem ipsum dolor sit amet, consectetur adipiscing elit. Sed do eiusmod tempor incididunt ut labore et dolore magna aliqua. Ut enim ad minim veniam, quis nostrud exercitation ullamco laboris nisi ut aliquip ex ea commodo consequat. Duis aute irure dolor in reprehenderit in voluptate velit esse cillum dolore eu fugiat nulla pariatur. Excepteur sint occaecat cupidatat non proident, sunt in culpa qui officia deserunt mollit anim id est laborum.
Curabitur pretium tincidunt lacus. Nulla gravida orci a odio, et viverra justo commodo id. Aliquam in felis sit amet augue laoreet fringilla. Suspendisse potenti. Sed in libero ut nibh placerat accumsan. Proin ac libero euismod, tincidunt nisi a, tincidunt nunc. Sed sit amet ipsum non quam tincidunt tincidunt. Nulla facilisi. Donec vel libero nec justo tincidunt tincidunt. Sed ut perspiciatis unde omnis iste natus error sit voluptatem accusantium doloremque laudantium, totam rem aperiam, eaque ipsa quae ab illo inventore veritatis et quasi architecto beatae vitae dicta sunt explicabo.
Integer in libero ut justo cursus tincidunt. Sed vitae libero sit amet dolor tincidunt tincidunt. Aenean euismod, nisi vel consectetur interdum, nisl nisi cursus nisi, vitae tincidunt nisi nisl eget nisi. Sed ut perspiciatis unde omnis iste natus error sit voluptatem accusantium doloremque laudantium, totam rem aperiam, eaque ipsa quae ab illo inventore veritatis et quasi architecto beatae vitae dicta sunt explicabo. Vivamus lacinia odio vitae vestibulum. Nulla facilisi. Sed ut perspiciatis unde omnis iste natus error sit voluptatem accusantium doloremque laudantium, totam rem aperiam, eaque ipsa quae ab illo inventore veritatis et quasi architecto beatae vitae dicta sunt explicabo.
Nam sit amet erat euismod, tincidunt nisi a, tincidunt nunc. Sed sit amet ipsum non quam tincidunt tincidunt. Nulla facilisi. Donec vel libero nec justo tincidunt tincidunt. Sed ut perspiciatis unde omnis iste natus error sit voluptatem accusantium doloremque laudantium, totam rem aperiam, eaque ipsa quae ab illo inventore veritatis et quasi architecto beatae vitae dicta sunt explicabo. Integer in libero ut justo cursus tincidunt. Sed vitae libero sit amet dolor tincidunt tincidunt.
Aliquam in felis sit amet augue laoreet fringilla. Suspendisse potenti. Sed in libero ut nibh placerat accumsan. Proin ac libero euismod, tincidunt nisi a, tincidunt nunc. Sed sit amet ipsum non quam tincidunt tincidunt. Nulla facilisi. Donec vel libero nec justo tincidunt tincidunt. Sed ut perspiciatis unde omnis iste natus error sit voluptatem accusantium doloremque laudantium, totam rem aperiam, eaque ipsa quae ab illo inventore veritatis et quasi architecto beatae vitae dicta sunt explicabo.
Curabitur pretium tincidunt lacus. Nulla gravida orci a odio, et viverra justo commodo id. Aliquam in felis sit amet augue laoreet fringilla. Suspendisse potenti. Sed in libero ut nibh placerat accumsan. Proin ac libero euismod, tincidunt nisi a, tincidunt nunc. Sed sit amet ipsum non quam tincidunt tincidunt. Nulla facilisi. Donec vel libero nec justo tincidunt tincidunt. Sed ut perspiciatis unde omnis iste natus error sit voluptatem accusantium doloremque laudantium, totam rem aperiam, eaque ipsa quae ab illo inventore veritatis et quasi architecto beatae vitae dicta sunt explicabo.
Integer in libero ut justo cursus tincidunt. Sed vitae libero sit amet dolor tincidunt tincidunt. Aenean euismod, nisi vel consectetur interdum, nisl nisi cursus nisi, vitae tincidunt nisi nisl eget nisi. Sed ut perspiciatis unde omnis iste natus error sit voluptatem accusantium doloremque laudantium, totam rem aperiam, eaque ipsa quae ab illo inventore veritatis et quasi architecto beatae vitae dicta sunt explicabo. Vivamus lacinia odio vitae vestibulum. Nulla facilisi. Sed ut perspiciatis unde omnis iste natus error sit voluptatem accusantium doloremque laudantium, totam rem aperiam, eaque ipsa quae ab illo inventore veritatis et quasi architecto beatae vitae dicta sunt explicabo.
Nam sit amet erat euismod, tincidunt nisi a, tincidunt nunc. Sed sit amet ipsum non quam tincidunt tincidunt. Nulla facilisi. Donec vel libero nec justo tincidunt tincidunt. Sed ut perspiciatis unde omnis iste natus error sit voluptatem accusantium doloremque laudantium, totam rem aperiam, eaque ipsa quae ab illo inventore veritatis et quasi architecto beatae vitae dicta sunt explicabo. Integer in libero ut justo cursus tincidunt. Sed vitae libero sit amet dolor tincidunt tincidunt.
- Identify the problem, or effect.
Define the problem or end effect that is being investigated and w ...
Lorem ipsum dolor sit amet, consectetur adipiscing elit. Sed do eiusmod tempor incididunt ut labore et dolore magna aliqua. Ut enim ad minim veniam, quis nostrud exercitation ullamco laboris nisi ut aliquip ex ea commodo consequat. Duis aute irure dolor in reprehenderit in voluptate velit esse cillum dolore eu fugiat nulla pariatur. Excepteur sint occaecat cupidatat non proident, sunt in culpa qui officia deserunt mollit anim id est laborum.
Curabitur pretium tincidunt lacus. Nulla gravida orci a odio, et viverra justo commodo id. Aliquam in felis sit amet augue laoreet fringilla. Suspendisse potenti. Sed in libero ut nibh placerat accumsan. Proin ac libero euismod, tincidunt nisi a, tincidunt nunc. Sed sit amet ipsum non quam tincidunt tincidunt. Nulla facilisi. Donec vel libero nec justo tincidunt tincidunt. Sed ut perspiciatis unde omnis iste natus error sit voluptatem accusantium doloremque laudantium, totam rem aperiam, eaque ipsa quae ab illo inventore veritatis et quasi architecto beatae vitae dicta sunt explicabo.
Integer in libero ut justo cursus tincidunt. Sed vitae libero sit amet dolor tincidunt tincidunt. Aenean euismod, nisi vel consectetur interdum, nisl nisi cursus nisi, vitae tincidunt nisi nisl eget nisi. Sed ut perspiciatis unde omnis iste natus error sit voluptatem accusantium doloremque laudantium, totam rem aperiam, eaque ipsa quae ab illo inventore veritatis et quasi architecto beatae vitae dicta sunt explicabo. Vivamus lacinia odio vitae vestibulum. Nulla facilisi. Sed ut perspiciatis unde omnis iste natus error sit voluptatem accusantium doloremque laudantium, totam rem aperiam, eaque ipsa quae ab illo inventore veritatis et quasi architecto beatae vitae dicta sunt explicabo.
Nam sit amet erat euismod, tincidunt nisi a, tincidunt nunc. Sed sit amet ipsum non quam tincidunt tincidunt. Nulla facilisi. Donec vel libero nec justo tincidunt tincidunt. Sed ut perspiciatis unde omnis iste natus error sit voluptatem accusantium doloremque laudantium, totam rem aperiam, eaque ipsa quae ab illo inventore veritatis et quasi architecto beatae vitae dicta sunt explicabo. Integer in libero ut justo cursus tincidunt. Sed vitae libero sit amet dolor tincidunt tincidunt.
Aliquam in felis sit amet augue laoreet fringilla. Suspendisse potenti. Sed in libero ut nibh placerat accumsan. Proin ac libero euismod, tincidunt nisi a, tincidunt nunc. Sed sit amet ipsum non quam tincidunt tincidunt. Nulla facilisi. Donec vel libero nec justo tincidunt tincidunt. Sed ut perspiciatis unde omnis iste natus error sit voluptatem accusantium doloremque laudantium, totam rem aperiam, eaque ipsa quae ab illo inventore veritatis et quasi architecto beatae vitae dicta sunt explicabo.
Curabitur pretium tincidunt lacus. Nulla gravida orci a odio, et viverra justo commodo id. Aliquam in felis sit amet augue laoreet fringilla. Suspendisse potenti. Sed in libero ut nibh placerat accumsan. Proin ac libero euismod, tincidunt nisi a, tincidunt nunc. Sed sit amet ipsum non quam tincidunt tincidunt. Nulla facilisi. Donec vel libero nec justo tincidunt tincidunt. Sed ut perspiciatis unde omnis iste natus error sit voluptatem accusantium doloremque laudantium, totam rem aperiam, eaque ipsa quae ab illo inventore veritatis et quasi architecto beatae vitae dicta sunt explicabo.
Integer in libero ut justo cursus tincidunt. Sed vitae libero sit amet dolor tincidunt tincidunt. Aenean euismod, nisi vel consectetur interdum, nisl nisi cursus nisi, vitae tincidunt nisi nisl eget nisi. Sed ut perspiciatis unde omnis iste natus error sit voluptatem accusantium doloremque laudantium, totam rem aperiam, eaque ipsa quae ab illo inventore veritatis et quasi architecto beatae vitae dicta sunt explicabo. Vivamus lacinia odio vitae vestibulum. Nulla facilisi. Sed ut perspiciatis unde omnis iste natus error sit voluptatem accusantium doloremque laudantium, totam rem aperiam, eaque ipsa quae ab illo inventore veritatis et quasi architecto beatae vitae dicta sunt explicabo.
Nam sit amet erat euismod, tincidunt nisi a, tincidunt nunc. Sed sit amet ipsum non quam tincidunt tincidunt. Nulla facilisi. Donec vel libero nec justo tincidunt tincidunt. Sed ut perspiciatis unde omnis iste natus error sit voluptatem accusantium doloremque laudantium, totam rem aperiam, eaque ipsa quae ab illo inventore veritatis et quasi architecto beatae vitae dicta sunt explicabo. Integer in libero ut justo cursus tincidunt. Sed vitae libero sit amet dolor tincidunt tincidunt.
Aliquam in felis sit amet augue laoreet fringilla. Suspendisse potenti. Sed in libero ut nibh placerat accumsan. Proin ac libero euismod, tincidunt nisi a, tincidunt nunc. Sed sit amet ipsum non quam tincidunt tincidunt. Nulla facilisi. Donec vel libero nec justo tincidunt tincidunt. Sed ut perspiciatis unde omnis iste natus error sit voluptatem accusantium doloremque laudantium, totam rem aperiam, eaque ipsa quae ab illo inventore veritatis et quasi architecto beatae vitae dicta sunt explicabo.
Curabitur pretium tincidunt lacus. Nulla gravida orci a odio, et viverra justo commodo id. Aliquam in felis sit amet augue laoreet fringilla. Suspendisse potenti. Sed in libero ut nibh placerat accumsan. Proin ac libero euismod, tincidunt nisi a, tincidunt nunc. Sed sit amet ipsum non quam tincidunt tincidunt. Nulla facilisi. Donec vel libero nec justo tincidunt tincidunt. Sed ut perspiciatis unde omnis iste natus error sit voluptatem accusantium doloremque laudantium, totam rem aperiam, eaque ipsa quae ab illo inventore veritatis et quasi architecto beatae vitae dicta sunt explicabo.
Integer in libero ut justo cursus tincidunt. Sed vitae libero sit amet dolor tincidunt tincidunt. Aenean euismod, nisi vel consectetur interdum, nisl nisi cursus nisi, vitae tincidunt nisi nisl eget nisi. Sed ut perspiciatis unde omnis iste natus error sit voluptatem accusantium doloremque laudantium, totam rem aperiam, eaque ipsa quae ab illo inventore veritatis et quasi architecto beatae vitae dicta sunt explicabo. Vivamus lacinia odio vitae vestibulum. Nulla facilisi. Sed ut perspiciatis unde omnis iste natus error sit voluptatem accusantium doloremque laudantium, totam rem aperiam, eaque ipsa quae ab illo inventore veritatis et quasi architecto beatae vitae dicta sunt explicabo.
Nam sit amet erat euismod, tincidunt nisi a, tincidunt nunc. Sed sit amet ipsum non quam tincidunt tincidunt. Nulla facilisi. Donec vel libero nec justo tincidunt tincidunt. Sed ut perspiciatis unde omnis iste natus error sit voluptatem accusantium doloremque laudantium, totam rem aperiam, eaque ipsa quae ab illo inventore veritatis et quasi architecto beatae vitae dicta sunt explicabo. Integer in libero ut justo cursus tincidunt. Sed vitae libero sit amet dolor tincidunt tincidunt.
Aliquam in felis sit amet augue laoreet fringilla. Suspendisse potenti. Sed in libero ut nibh placerat accumsan. Proin ac libero euismod, tincidunt nisi a, tincidunt nunc. Sed sit amet ipsum non quam tincidunt tincidunt. Nulla facilisi. Donec vel libero nec justo tincidunt tincidunt. Sed ut perspiciatis unde omnis iste natus error sit voluptatem accusantium doloremque laudantium, totam rem aperiam, eaque ipsa quae ab illo inventore veritatis et quasi architecto beatae vitae dicta sunt explicabo.
Curabitur pretium tincidunt lacus. Nulla gravida orci a odio, et viverra justo commodo id. Aliquam in felis sit amet augue laoreet fringilla. Suspendisse potenti. Sed in libero ut nibh placerat accumsan. Proin ac libero euismod, tincidunt nisi a, tincidunt nunc. Sed sit amet ipsum non quam tincidunt tincidunt. Nulla facilisi. Donec vel libero nec justo tincidunt tincidunt. Sed ut perspiciatis unde omnis iste natus error sit voluptatem accusantium doloremque laudantium, totam rem aperiam, eaque ipsa quae ab illo inventore veritatis et quasi architecto beatae vitae dicta sunt explicabo.
Integer in libero ut justo cursus tincidunt. Sed vitae libero sit amet dolor tincidunt tincidunt. Aenean euismod, nisi vel consectetur interdum, nisl nisi cursus nisi, vitae tincidunt nisi nisl eget nisi. Sed ut perspiciatis unde omnis iste natus error sit voluptatem accusantium doloremque laudantium, totam rem aperiam, eaque ipsa quae ab illo inventore veritatis et quasi architecto beatae vitae dicta sunt explicabo. Vivamus lacinia odio vitae vestibulum. Nulla facilisi. Sed ut perspiciatis unde omnis iste natus error sit voluptatem accusantium doloremque laudantium, totam rem aperiam, eaque ipsa quae ab illo inventore veritatis et quasi architecto beatae vitae dicta sunt explicabo.
Nam sit amet erat euismod, tincidunt nisi a, tincidunt nunc. Sed sit amet ipsum non quam tincidunt tincidunt. Nulla facilisi. Donec vel libero nec justo tincidunt tincidunt. Sed ut perspiciatis unde omnis iste natus error sit voluptatem accusantium doloremque laudantium, totam rem aperiam, eaque ipsa quae ab illo inventore veritatis et quasi architecto beatae vitae dicta sunt explicabo. Integer in libero ut justo cursus tincidunt. Sed vitae libero sit amet dolor tincidunt tincidunt.
Aliquam in felis sit amet augue laoreet fringilla. Suspendisse potenti. Sed in libero ut nibh placerat accumsan. Proin ac libero euismod, tincidunt nisi a, tincidunt nunc. Sed sit amet ipsum non quam tincidunt tincidunt. Nulla facilisi. Donec vel libero nec justo tincidunt tincidunt. Sed ut perspiciatis unde omnis iste natus error sit voluptatem accusantium doloremque laudantium, totam rem aperiam, eaque ipsa quae ab illo inventore veritatis et quasi architecto beatae vitae dicta sunt explicabo.
Curabitur pretium tincidunt lacus. Nulla gravida orci a odio, et viverra justo commodo id. Aliquam in felis sit amet augue laoreet fringilla. Suspendisse potenti. Sed in libero ut nibh placerat accumsan. Proin ac libero euismod, tincidunt nisi a, tincidunt nunc. Sed sit amet ipsum non quam tincidunt tincidunt. Nulla facilisi. Donec vel libero nec justo tincidunt tincidunt. Sed ut perspiciatis unde omnis iste natus error sit voluptatem accusantium doloremque laudantium, totam rem aperiam, eaque ipsa quae ab illo inventore veritatis et quasi architecto beatae vitae dicta sunt explicabo.
Integer in libero ut justo cursus tincidunt. Sed vitae libero sit amet dolor tincidunt tincidunt. Aenean euismod, nisi vel consectetur interdum, nisl nisi cursus nisi, vitae tincidunt nisi nisl eget nisi. Sed ut perspiciatis unde omnis iste natus error sit voluptatem accusantium doloremque laudantium, totam rem aperiam, eaque ipsa quae ab illo inventore veritatis et quasi architecto beatae vitae dicta sunt explicabo. Vivamus lacinia odio vitae vestibulum. Nulla facilisi. Sed ut perspiciatis unde omnis iste natus error sit voluptatem accusantium doloremque laudantium, totam rem aperiam, eaque ipsa quae ab illo inventore veritatis et quasi architecto beatae vitae dicta sunt explicabo.
Nam sit amet erat euismod, tincidunt nisi a, tincidunt nunc. Sed sit amet ipsum non quam tincidunt tincidunt. Nulla facilisi. Donec vel libero nec justo tincidunt tincidunt. Sed ut perspiciatis unde omnis iste natus error sit voluptatem accusantium doloremque laudantium, totam rem aperiam, eaque ipsa quae ab illo inventore veritatis et quasi architecto beatae vitae dicta sunt explicabo. Integer in libero ut justo cursus tincidunt. Sed vitae libero sit amet dolor tincidunt tincidunt.
Aliquam in felis sit amet augue laoreet fringilla. Suspendisse potenti. Sed in libero ut nibh placerat accumsan. Proin ac libero euismod, tincidunt nisi a, tincidunt nunc. Sed sit amet ipsum non quam tincidunt tincidunt. Nulla facilisi. Donec vel libero nec justo tincidunt tincidunt. Sed ut perspiciatis unde omnis iste natus error sit voluptatem accusantium doloremque laudantium, totam rem aperiam, eaque ipsa quae ab illo inventore veritatis et quasi architecto beatae vitae dicta sunt explicabo.
Curabitur pretium tincidunt lacus. Nulla gravida orci a odio, et viverra justo commodo id. Aliquam in felis sit amet augue laoreet fringilla. Suspendisse potenti. Sed in libero ut nibh placerat accumsan. Proin ac libero euismod, tincidunt nisi a, tincidunt nunc. Sed sit amet ipsum non quam tincidunt tincidunt. Nulla facilisi. Donec vel libero nec justo tincidunt tincidunt. Sed ut perspiciatis unde omnis iste natus error sit voluptatem accusantium doloremque laudantium, totam rem aperiam, eaque ipsa quae ab illo inventore veritatis et quasi architecto beatae vitae dicta sunt explicabo.
Integer in libero ut justo cursus tincidunt. Sed vitae libero sit amet dolor tincidunt tincidunt. Aenean euismod, nisi vel consectetur interdum, nisl nisi cursus nisi, vitae tincidunt nisi nisl eget nisi. Sed ut perspiciatis unde omnis iste natus error sit voluptatem accusantium doloremque laudantium, totam rem aperiam, eaque ipsa quae ab illo inventore veritatis et quasi architecto beatae vitae dicta sunt explicabo. Vivamus lacinia odio vitae vestibulum. Nulla facilisi. Sed ut perspiciatis unde omnis iste natus error sit voluptatem accusantium doloremque laudantium, totam rem aperiam, eaque ipsa quae ab illo inventore veritatis et quasi architecto beatae vitae dicta sunt explicabo.
Nam sit amet erat euismod, tincidunt nisi a, tincidunt nunc. Sed sit amet ipsum non quam tincidunt tincidunt. Nulla facilisi. Donec vel libero nec justo tincidunt tincidunt. Sed ut perspiciatis unde omnis iste natus error sit voluptatem accusantium doloremque laudantium, totam rem aperiam, eaque ipsa quae ab illo inventore veritatis et quasi architecto beatae vitae dicta sunt explicabo. Integer in libero ut justo cursus tincidunt. Sed vitae libero sit amet dolor tincidunt tincidunt.
Aliquam in felis sit amet augue laoreet fringilla. Suspendisse potenti. Sed in libero ut nibh placerat accumsan. Proin ac libero euismod, tincidunt nisi a, tincidunt nunc. Sed sit amet ipsum non quam tincidunt tincidunt. Nulla facilisi. Donec vel libero nec justo tincidunt tincidunt. Sed ut perspiciatis unde omnis iste natus error sit voluptatem accusantium doloremque laudantium, totam rem aperiam, eaque ipsa quae ab illo inventore veritatis et quasi architecto beatae vitae dicta sunt explicabo.
Curabitur pretium tincidunt lacus. Nulla gravida orci a odio, et viverra justo commodo id. Aliquam in felis sit amet augue laoreet fringilla. Suspendisse potenti. Sed in libero ut nibh placerat accumsan. Proin ac libero euismod, tincidunt nisi a, tincidunt nunc. Sed sit amet ipsum non quam tincidunt tincidunt. Nulla facilisi. Donec vel libero nec justo tincidunt tincidunt. Sed ut perspiciatis unde omnis iste natus error sit voluptatem accusantium doloremque laudantium, totam rem aperiam, eaque ipsa quae ab illo inventore veritatis et quasi architecto beatae vitae dicta sunt explicabo.
Integer in libero ut justo cursus tincidunt. Sed vitae libero sit amet dolor tincidunt tincidunt. Aenean euismod, nisi vel consectetur interdum, nisl nisi cursus nisi, vitae tincidunt nisi nisl eget nisi. Sed ut perspiciatis unde omnis iste natus error sit voluptatem accusantium doloremque laudantium, totam rem aperiam, eaque ipsa quae ab illo inventore veritatis et quasi architecto beatae vitae dicta sunt explicabo. Vivamus lacinia odio vitae vestibulum. Nulla facilisi. Sed ut perspiciatis unde omnis iste natus error sit voluptatem accusantium doloremque laudantium, totam rem aperiam, eaque ipsa quae ab illo inventore veritatis et quasi architecto beatae vitae dicta sunt explicabo.
Nam sit amet erat euismod, tincidunt nisi a, tincidunt nunc. Sed sit amet ipsum non quam tincidunt tincidunt. Nulla facilisi. Donec vel libero nec justo tincidunt tincidunt. Sed ut perspiciatis unde omnis iste natus error sit voluptatem accusantium doloremque laudantium, totam rem aperiam, eaque ipsa quae ab illo inventore veritatis et quasi architecto beatae vitae dicta sunt explicabo. Integer in libero ut justo cursus tincidunt. Sed vitae libero sit amet dolor tincidunt tincidunt.
Aliquam in felis sit amet augue laoreet fringilla. Suspendisse potenti. Sed in libero ut nibh placerat accumsan. Proin ac libero euismod, tincidunt nisi a, tincidunt nunc. Sed sit amet ipsum non quam tincidunt tincidunt. Nulla facilisi. Donec vel libero nec justo tincidunt tincidunt. Sed ut perspiciatis unde omnis iste natus error sit voluptatem accusantium doloremque laudantium, totam rem aperiam, eaque ipsa quae ab illo inventore veritatis et quasi architecto beatae vitae dicta sunt explicabo.
Curabitur pretium tincidunt lacus. Nulla gravida orci a odio, et viverra justo commodo id. Aliquam in felis sit amet augue laoreet fringilla. Suspendisse potenti. Sed in libero ut nibh placerat accumsan. Proin ac libero euismod, tincidunt nisi a, tincidunt nunc. Sed sit amet ipsum non quam tincidunt tincidunt. Nulla facilisi. Donec vel libero nec justo tincidunt tincidunt. Sed ut perspiciatis unde omnis iste natus error sit voluptatem accusantium doloremque laudantium, totam rem aperiam, eaque ipsa quae ab illo inventore veritatis et quasi architecto beatae vitae dicta sunt explicabo.
Integer in libero ut justo cursus tincidunt. Sed vitae libero sit amet dolor tincidunt tincidunt. Aenean euismod, nisi vel consectetur interdum, nisl nisi cursus nisi, vitae tincidunt nisi nisl eget nisi. Sed ut perspiciatis unde omnis iste natus error sit voluptatem accusantium doloremque laudantium, totam rem aperiam, eaque ipsa quae ab illo inventore veritatis et quasi architecto beatae vitae dicta sunt explicabo. Vivamus lacinia odio vitae vestibulum. Nulla facilisi. Sed ut perspiciatis unde omnis iste natus error sit voluptatem accusantium doloremque laudantium, totam rem aperiam, eaque ipsa quae ab illo inventore veritatis et quasi architecto beatae vitae dicta sunt explicabo.
Nam sit amet erat euismod, tincidunt nisi a, tincidunt nunc. Sed sit amet ipsum non quam tincidunt tincidunt. Nulla facilisi. Donec vel libero nec justo tincidunt tincidunt. Sed ut perspiciatis unde omnis iste natus error sit voluptatem accusantium doloremque laudantium, totam rem aperiam, eaque ipsa quae ab illo inventore veritatis et quasi architecto beatae vitae dicta sunt explicabo. Integer in libero ut justo cursus tincidunt. Sed vitae libero sit amet dolor tincidunt tincidunt.
Aliquam in felis sit amet augue laoreet fringilla. Suspendisse potenti. Sed in libero ut nibh placerat accumsan. Proin ac libero euismod, tincidunt nisi a, tincidunt nunc. Sed sit amet ipsum non quam tincidunt tincidunt. Nulla facilisi. Donec vel libero nec justo tincidunt tincidunt. Sed ut perspiciatis unde omnis iste natus error sit voluptatem accusantium doloremque laudantium, totam rem aperiam, eaque ipsa quae ab illo inventore veritatis et quasi architecto beatae vitae dicta sunt explicabo.
Curabitur pretium tincidunt lacus. Nulla gravida orci a odio, et viverra justo commodo id. Aliquam in felis sit amet augue laoreet fringilla. Suspendisse potenti. Sed in libero ut nibh placerat accumsan. Proin ac libero euismod, tincidunt nisi a, tincidunt nunc. Sed sit amet ipsum non quam tincidunt tincidunt. Nulla facilisi. Donec vel libero nec justo tincidunt tincidunt. Sed ut perspiciatis unde omnis iste natus error sit voluptatem accusantium doloremque laudantium, totam rem aperiam, eaque ipsa quae ab illo inventore veritatis et quasi architecto beatae vitae dicta sunt explicabo.
Integer in libero ut justo cursus tincidunt. Sed vitae libero sit amet dolor tincidunt tincidunt. Aenean euismod, nisi vel consectetur interdum, nisl nisi cursus nisi, vitae tincidunt nisi nisl eget nisi. Sed ut perspiciatis unde omnis iste natus error sit voluptatem accusantium doloremque laudantium, totam rem aperiam, eaque ipsa quae ab illo inventore veritatis et quasi architecto beatae vitae dicta sunt explicabo. Vivamus lacinia odio vitae vestibulum. Nulla facilisi. Sed ut perspiciatis unde omnis iste natus error sit voluptatem accusantium doloremque laudantium, totam rem aperiam, eaque ipsa quae ab illo inventore veritatis et quasi architecto beatae vitae dicta sunt explicabo.
Nam sit amet erat euismod, tincidunt nisi a, tincidunt nunc. Sed sit amet ipsum non quam tincidunt tincidunt. Nulla facilisi. Donec vel libero nec justo tincidunt tincidunt. Sed ut perspiciatis unde omnis iste natus error sit voluptatem accusantium doloremque laudantium, totam rem aperiam, eaque ipsa quae ab illo inventore veritatis et quasi architecto beatae vitae dicta sunt explicabo. Integer in libero ut justo cursus tincidunt. Sed vitae libero sit amet dolor tincidunt tincidunt.
Aliquam in felis sit amet augue laoreet fringilla. Suspendisse potenti. Sed in libero ut nibh placerat accumsan. Proin ac libero euismod, tincidunt nisi a, tincidunt nunc. Sed sit amet ipsum non quam tincidunt tincidunt. Nulla facilisi. Donec vel libero nec justo tincidunt tincidunt. Sed ut perspiciatis unde omnis iste natus error sit voluptatem accusantium doloremque laudantium, totam rem aperiam, eaque ipsa quae ab illo inventore veritatis et quasi architecto beatae vitae dicta sunt explicabo.
Curabitur pretium tincidunt lacus. Nulla gravida orci a odio, et viverra justo commodo id. Aliquam in felis sit amet augue laoreet fringilla. Suspendisse potenti. Sed in libero ut nibh placerat accumsan. Proin ac libero euismod, tincidunt nisi a, tincidunt nunc. Sed sit amet ipsum non quam tincidunt tincidunt. Nulla facilisi. Donec vel libero nec justo tincidunt tincidunt. Sed ut perspiciatis unde omnis iste natus error sit voluptatem accusantium doloremque laudantium, totam rem aperiam, eaque ipsa quae ab illo inventore veritatis et quasi architecto beatae vitae dicta sunt explicabo.
Integer in libero ut justo cursus tincidunt. Sed vitae libero sit amet dolor tincidunt tincidunt. Aenean euismod, nisi vel consectetur interdum, nisl nisi cursus nisi, vitae tincidunt nisi nisl eget nisi. Sed ut perspiciatis unde omnis iste natus error sit voluptatem accusantium doloremque laudantium, totam rem aperiam, eaque ipsa quae ab illo inventore veritatis et quasi architecto beatae vitae dicta sunt explicabo. Vivamus lacinia odio vitae vestibulum. Nulla facilisi. Sed ut perspiciatis unde omnis iste natus error sit voluptatem accusantium doloremque laudantium, totam rem aperiam, eaque ipsa quae ab illo inventore veritatis et quasi architecto beatae vitae dicta sunt explicabo.
Nam sit amet erat euismod, tincidunt nisi a, tincidunt nunc. Sed sit amet ipsum non quam tincidunt tincidunt. Nulla facilisi. Donec vel libero nec justo tincidunt tincidunt. Sed ut perspiciatis unde omnis iste natus error sit voluptatem accusantium doloremque laudantium, totam rem aperiam, eaque ipsa quae ab illo inventore veritatis et quasi architecto beatae vitae dicta sunt explicabo. Integer in libero ut justo cursus tincidunt. Sed vitae libero sit amet dolor tincidunt tincidunt.
Aliquam in felis sit amet augue laoreet fringilla. Suspendisse potenti. Sed in libero ut nibh placerat accumsan. Proin ac libero euismod, tincidunt nisi a, tincidunt nunc. Sed sit amet ipsum non quam tincidunt tincidunt. Nulla facilisi. Donec vel libero nec justo tincidunt tincidunt. Sed ut perspiciatis unde omnis iste natus error sit voluptatem accusantium doloremque laudantium, totam rem aperiam, eaque ipsa quae ab illo inventore veritatis et quasi architecto beatae vitae dicta sunt explicabo.
Curabitur pretium tincidunt lacus. Nulla gravida orci a odio, et viverra justo commodo id. Aliquam in felis sit amet augue laoreet fringilla. Suspendisse potenti. Sed in libero ut nibh placerat accumsan. Proin ac libero euismod, tincidunt nisi a, tincidunt nunc. Sed sit amet ipsum non quam tincidunt tincidunt. Nulla facilisi. Donec vel libero nec justo tincidunt tincidunt. Sed ut perspiciatis unde omnis iste natus error sit voluptatem accusantium doloremque laudantium, totam rem aperiam, eaque ipsa quae ab illo inventore veritatis et quasi architecto beatae vitae dicta sunt explicabo.
Integer in libero ut justo cursus tincidunt. Sed vitae libero sit amet dolor tincidunt tincidunt. Aenean euismod, nisi vel consectetur interdum, nisl nisi cursus nisi, vitae tincidunt nisi nisl eget nisi. Sed ut perspiciatis unde omnis iste natus error sit voluptatem accusantium doloremque laudantium, totam rem aperiam, eaque ipsa quae ab illo inventore veritatis et quasi architecto beatae vitae dicta sunt explicabo. Vivamus lacinia odio vitae vestibulum. Nulla facilisi. Sed ut perspiciatis unde omnis iste natus error sit voluptatem accusantium doloremque laudantium, totam rem aperiam, eaque ipsa quae ab illo inventore veritatis et quasi architecto beatae vitae dicta sunt explicabo.
Nam sit amet erat euismod, tincidunt nisi a, tincidunt nunc. Sed sit amet ipsum non quam tincidunt tincidunt. Nulla facilisi. Donec vel libero nec justo tincidunt tincidunt. Sed ut perspiciatis unde omnis iste natus error sit voluptatem accusantium doloremque laudantium, totam rem aperiam, eaque ipsa quae ab illo inventore veritatis et quasi architecto beatae vitae dicta sunt explicabo. Integer in libero ut justo cursus tincidunt. Sed vitae libero sit amet dolor tincidunt tincidunt.
Aliquam in felis sit amet augue laoreet fringilla. Suspendisse potenti. Sed in libero ut nibh placerat accumsan. Proin ac libero euismod, tincidunt nisi a, tincidunt nunc. Sed sit amet ipsum non quam tincidunt tincidunt. Nulla facilisi. Donec vel libero nec justo tincidunt tincidunt. Sed ut perspiciatis unde omnis iste natus error sit voluptatem accusantium doloremque laudantium, totam rem aperiam, eaque ipsa quae ab illo inventore veritatis et quasi architecto beatae vitae dicta sunt explicabo.
Curabitur pretium tincidunt lacus. Nulla gravida orci a odio, et viverra justo commodo id. Aliquam in felis sit amet augue laoreet fringilla. Suspendisse potenti. Sed in libero ut nibh placerat accumsan. Proin ac libero euismod, tincidunt nisi a, tincidunt nunc. Sed sit amet ipsum non quam tincidunt tincidunt. Nulla facilisi. Donec vel libero nec justo tincidunt tincidunt. Sed ut perspiciatis unde omnis iste natus error sit voluptatem accusantium doloremque laudantium, totam rem aperiam, eaque ipsa quae ab illo inventore veritatis et quasi architecto beatae vitae dicta sunt explicabo.
Integer in libero ut justo cursus tincidunt. Sed vitae libero sit amet dolor tincidunt tincidunt. Aenean euismod, nisi vel consectetur interdum, nisl nisi cursus nisi, vitae tincidunt nisi nisl eget nisi. Sed ut perspiciatis unde omnis iste natus error sit voluptatem accusantium doloremque laudantium, totam rem aperiam, eaque ipsa quae ab illo inventore veritatis et quasi architecto beatae vitae dicta sunt explicabo. Vivamus lacinia odio vitae vestibulum. Nulla facilisi. Sed ut perspiciatis unde omnis iste natus error sit voluptatem accusantium doloremque laudantium, totam rem aperiam, eaque ipsa quae ab illo inventore veritatis et quasi architecto beatae vitae dicta sunt explicabo.
Nam sit amet erat euismod, tincidunt nisi a, tincidunt nunc. Sed sit amet ipsum non quam tincidunt tincidunt. Nulla facilisi. Donec vel libero nec justo tincidunt tincidunt. Sed ut perspiciatis unde omnis iste natus error sit voluptatem accusantium doloremque laudantium, totam rem aperiam, eaque ipsa quae ab illo inventore veritatis et quasi architecto beatae vitae dicta sunt explicabo. Integer in libero ut justo cursus tincidunt. Sed vitae libero sit amet dolor tincidunt tincidunt.
Aliquam in felis sit amet augue laoreet fringilla. Suspendisse potenti. Sed in libero ut nibh placerat accumsan. Proin ac libero euismod, tincidunt nisi a, tincidunt nunc. Sed sit amet ipsum non quam tincidunt tincidunt. Nulla facilisi. Donec vel libero nec justo tincidunt tincidunt. Sed ut perspiciatis unde omnis iste natus error sit voluptatem accusantium doloremque laudantium, totam rem aperiam, eaque ipsa quae ab illo inventore veritatis et quasi architecto beatae vitae dicta sunt explicabo.
Curabitur pretium tincidunt lacus. Nulla gravida orci a odio, et viverra justo commodo id. Aliquam in felis sit amet augue laoreet fringilla. Suspendisse potenti. Sed in libero ut nibh placerat accumsan. Proin ac libero euismod, tincidunt nisi a, tincidunt nunc. Sed sit amet ipsum non quam tincidunt tincidunt. Nulla facilisi. Donec vel libero nec justo tincidunt tincidunt. Sed ut perspiciatis unde omnis iste natus error sit voluptatem accusantium doloremque laudantium, totam rem aperiam, eaque ipsa quae ab illo inventore veritatis et quasi architecto beatae vitae dicta sunt explicabo.
Integer in libero ut justo cursus tincidunt. Sed vitae libero sit amet dolor tincidunt tincidunt. Aenean euismod, nisi vel consectetur interdum, nisl nisi cursus nisi, vitae tincidunt nisi nisl eget nisi. Sed ut perspiciatis unde omnis iste natus error sit voluptatem accusantium doloremque laudantium, totam rem aperiam, eaque ipsa quae ab illo inventore veritatis et quasi architecto beatae vitae dicta sunt explicabo. Vivamus lacinia odio vitae vestibulum. Nulla facilisi. Sed ut perspiciatis unde omnis iste natus error sit voluptatem accusantium doloremque laudantium, totam rem aperiam, eaque ipsa quae ab illo inventore veritatis et quasi architecto beatae vitae dicta sunt explicabo.
Nam sit amet erat euismod, tincidunt nisi a, tincidunt nunc. Sed sit amet ipsum non quam tincidunt tincidunt. Nulla facilisi. Donec vel libero nec justo tincidunt tincidunt. Sed ut perspiciatis unde omnis iste natus error sit voluptatem accusantium doloremque laudantium, totam rem aperiam, eaque ipsa quae ab illo inventore veritatis et quasi architecto beatae vitae dicta sunt explicabo. Integer in libero ut justo cursus tincidunt. Sed vitae libero sit amet dolor tincidunt tincidunt.
Aliquam in felis sit amet augue laoreet fringilla. Suspendisse potenti. Sed in libero ut nibh placerat accumsan. Proin ac libero euismod, tincidunt nisi a, tincidunt nunc. Sed sit amet ipsum non quam tincidunt tincidunt. Nulla facilisi. Donec vel libero nec justo tincidunt tincidunt. Sed ut perspiciatis unde omnis iste natus error sit voluptatem accusantium doloremque laudantium, totam rem aperiam, eaque ipsa quae ab illo inventore veritatis et quasi architecto beatae vitae dicta sunt explicabo.
Curabitur pretium tincidunt lacus. Nulla gravida orci a odio, et viverra justo commodo id. Aliquam in felis sit amet augue laoreet fringilla. Suspendisse potenti. Sed in libero ut nibh placerat accumsan. Proin ac libero euismod, tincidunt nisi a, tincidunt nunc. Sed sit amet ipsum non quam tincidunt tincidunt. Nulla facilisi. Donec vel libero nec justo tincidunt tincidunt. Sed ut perspiciatis unde omnis iste natus error sit voluptatem accusantium doloremque laudantium, totam rem aperiam, eaque ipsa quae ab illo inventore veritatis et quasi architecto beatae vitae dicta sunt explicabo.
Integer in libero ut justo cursus tincidunt. Sed vitae libero sit amet dolor tincidunt tincidunt. Aenean euismod, nisi vel consectetur interdum, nisl nisi cursus nisi, vitae tincidunt nisi nisl eget nisi. Sed ut perspiciatis unde omnis iste natus error sit voluptatem accusantium doloremque laudantium, totam rem aperiam, eaque ipsa quae ab illo inventore veritatis et quasi architecto beatae vitae dicta sunt explicabo. Vivamus lacinia odio vitae vestibulum. Nulla facilisi. Sed ut perspiciatis unde omnis iste natus error sit voluptatem accusantium doloremque laudantium, totam rem aperiam, eaque ipsa quae ab illo inventore veritatis et quasi architecto beatae vitae dicta sunt explicabo.
Nam sit amet erat euismod, tincidunt nisi a, tincidunt nunc. Sed sit amet ipsum non quam tincidunt tincidunt. Nulla facilisi. Donec vel libero nec justo tincidunt tincidunt. Sed ut perspiciatis unde omnis iste natus error sit voluptatem accusantium doloremque laudantium, totam rem aperiam, eaque ipsa quae ab illo inventore veritatis et quasi architecto beatae vitae dicta sunt explicabo. Integer in libero ut justo cursus tincidunt. Sed vitae libero sit amet dolor tincidunt tincidunt.
Aliquam in felis sit amet augue laoreet fringilla. Suspendisse potenti. Sed in libero ut nibh placerat accumsan. Proin ac libero euismod, tincidunt nisi a, tincidunt nunc. Sed sit amet ipsum non quam tincidunt tincidunt. Nulla facilisi. Donec vel libero nec justo tincidunt tincidunt. Sed ut perspiciatis unde omnis iste natus error sit voluptatem accusantium doloremque laudantium, totam rem aperiam, eaque ipsa quae ab illo inventore veritatis et quasi architecto beatae vitae dicta sunt explicabo.
Curabitur pretium tincidunt lacus. Nulla gravida orci a odio, et viverra justo commodo id. Aliquam in felis sit amet augue laoreet fringilla. Suspendisse potenti. Sed in libero ut nibh placerat accumsan. Proin ac libero euismod, tincidunt nisi a, tincidunt nunc. Sed sit amet ipsum non quam tincidunt tincidunt. Nulla facilisi. Donec vel libero nec justo tincidunt tincidunt. Sed ut perspiciatis unde omnis iste natus error sit voluptatem accusantium doloremque laudantium, totam rem aperiam, eaque ipsa quae ab illo inventore veritatis et quasi architecto beatae vitae dicta sunt explicabo.
Integer in libero ut justo cursus tincidunt. Sed vitae libero sit amet dolor tincidunt tincidunt. Aenean euismod, nisi vel consectetur interdum, nisl nisi cursus nisi, vitae tincidunt nisi nisl eget nisi. Sed ut perspiciatis unde omnis iste natus error sit voluptatem accusantium doloremque laudantium, totam rem aperiam, eaque ipsa quae ab illo inventore veritatis et quasi architecto beatae vitae dicta sunt explicabo. Vivamus lacinia odio vitae vestibulum. Nulla facilisi. Sed ut perspiciatis unde omnis iste natus error sit voluptatem accusantium doloremque laudantium, totam rem aperiam, eaque ipsa quae ab illo inventore veritatis et quasi architecto beatae vitae dicta sunt explicabo.
Nam sit amet erat euismod, tincidunt nisi a, tincidunt nunc. Sed sit amet ipsum non quam tincidunt tincidunt. Nulla facilisi. Donec vel libero nec justo tincidunt tincidunt. Sed ut perspiciatis unde omnis iste natus error sit voluptatem accusantium doloremque laudantium, totam rem aperiam, eaque ipsa quae ab illo inventore veritatis et quasi architecto beatae vitae dicta sunt explicabo. Integer in libero ut justo cursus tincidunt. Sed vitae libero sit amet dolor tincidunt tincidunt.
Aliquam in felis sit amet augue laoreet fringilla. Suspendisse potenti. Sed in libero ut nibh placerat accumsan. Proin ac libero euismod, tincidunt nisi a, tincidunt nunc. Sed sit amet ipsum non quam tincidunt tincidunt. Nulla facilisi. Donec vel libero nec justo tincidunt tincidunt. Sed ut perspiciatis unde omnis iste natus error sit voluptatem accusantium doloremque laudantium, totam rem aperiam, eaque ipsa quae ab illo inventore veritatis et quasi architecto beatae vitae dicta sunt explicabo.
Curabitur pretium tincidunt lacus. Nulla gravida orci a odio, et viverra justo commodo id. Aliquam in felis sit amet augue laoreet fringilla. Suspendisse potenti. Sed in libero ut nibh placerat accumsan. Proin ac libero euismod, tincidunt nisi a, tincidunt nunc. Sed sit amet ipsum non quam tincidunt tincidunt. Nulla facilisi. Donec vel libero nec justo tincidunt tincidunt. Sed ut perspiciatis unde omnis iste natus error sit voluptatem accusantium doloremque laudantium, totam rem aperiam, eaque ipsa quae ab illo inventore veritatis et quasi architecto beatae vitae dicta sunt explicabo.
Integer in libero ut justo cursus tincidunt. Sed vitae libero sit amet dolor tincidunt tincidunt. Aenean euismod, nisi vel consectetur interdum, nisl nisi cursus nisi, vitae tincidunt nisi nisl eget nisi. Sed ut perspiciatis unde omnis iste natus error sit voluptatem accusantium doloremque laudantium, totam rem aperiam, eaque ipsa quae ab illo inventore veritatis et quasi architecto beatae vitae dicta sunt explicabo. Vivamus lacinia odio vitae vestibulum. Nulla facilisi. Sed ut perspiciatis unde omnis iste natus error sit voluptatem accusantium doloremque laudantium, totam rem aperiam, eaque ipsa quae ab illo inventore veritatis et quasi architecto beatae vitae dicta sunt explicabo.
Nam sit amet erat euismod, tincidunt nisi a, tincidunt nunc. Sed sit amet ipsum non quam tincidunt tincidunt. Nulla facilisi. Donec vel libero nec justo tincidunt tincidunt. Sed ut perspiciatis unde omnis iste natus error sit voluptatem accusantium doloremque laudantium, totam rem aperiam, eaque ipsa quae ab illo inventore veritatis et quasi architecto beatae vitae dicta sunt explicabo. Integer in libero ut justo cursus tincidunt. Sed vitae libero sit amet dolor tincidunt tincidunt.


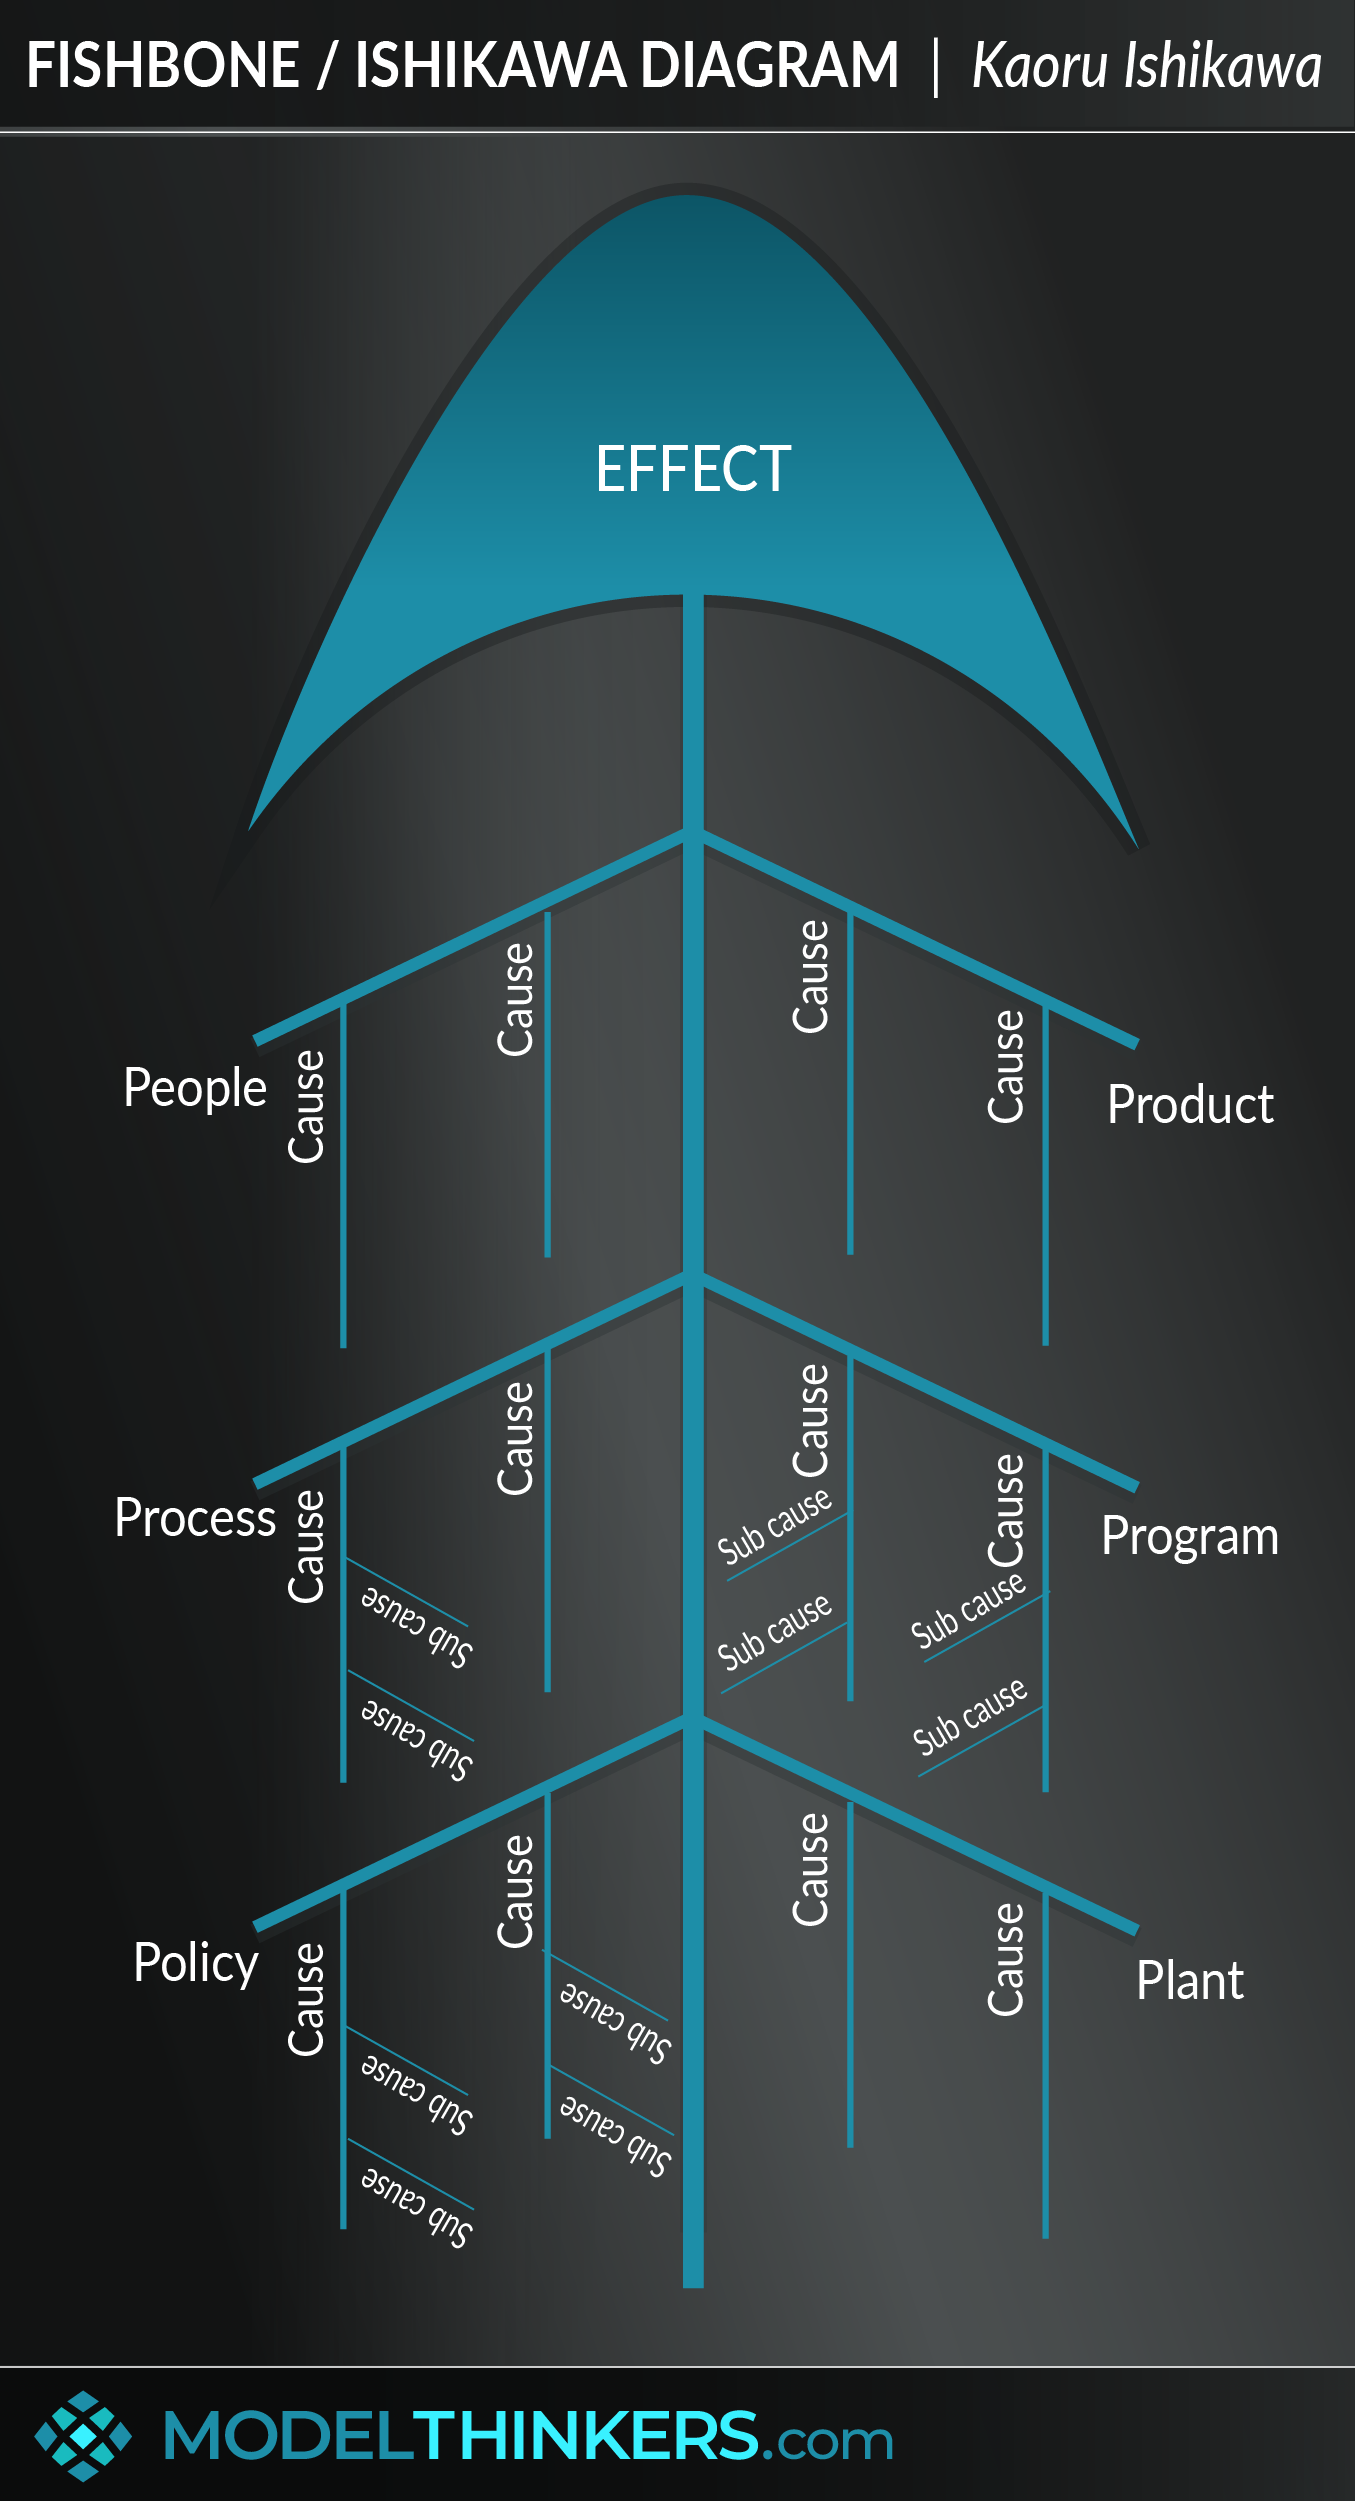
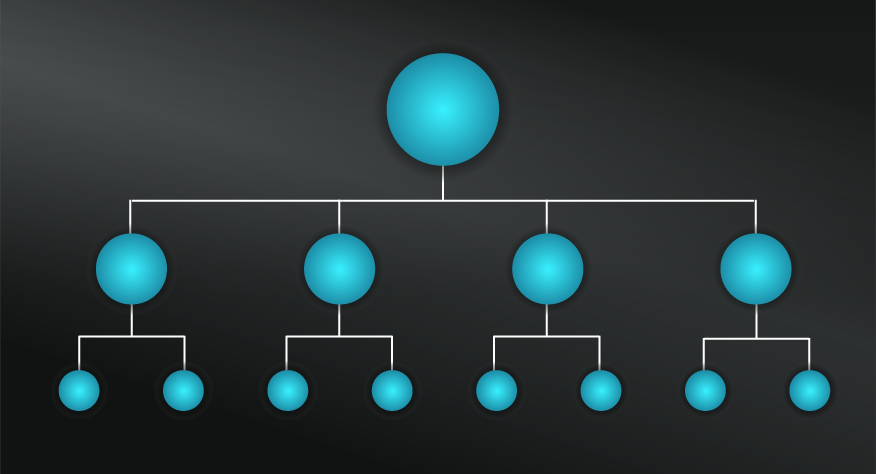
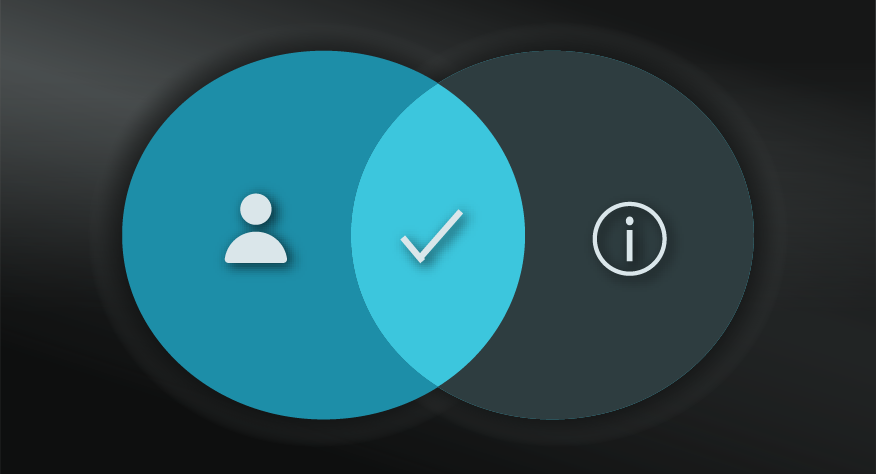
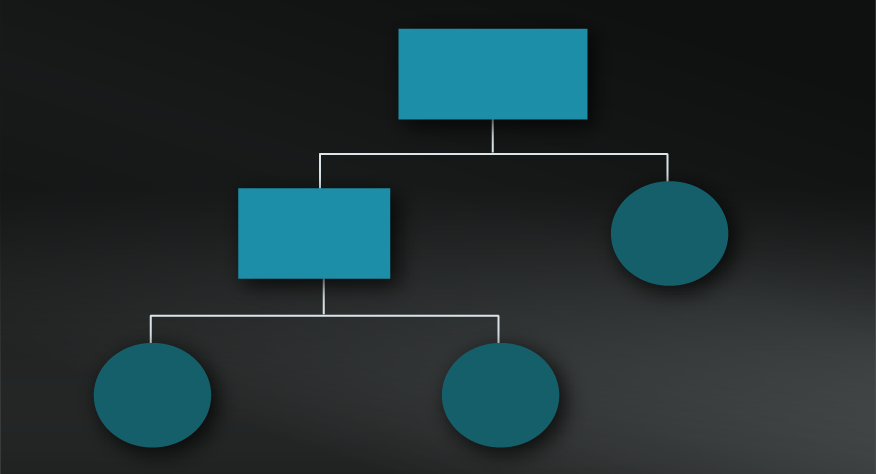
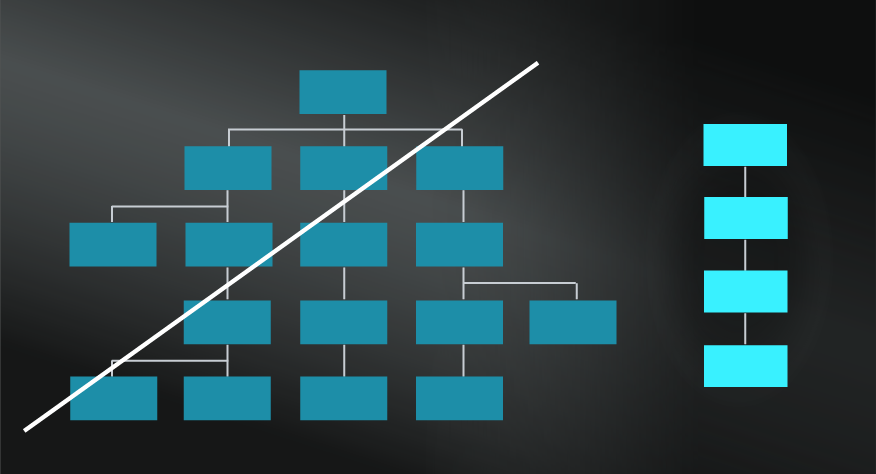
The main issues with the diagram are the differentiation between causes and sub causes. For example, some causes might be complex, with many elements below them, becoming impractical to capture in the diagram. By breaking it up into separate categories, the diagram also does not lend itself to a more connected view of challenges.
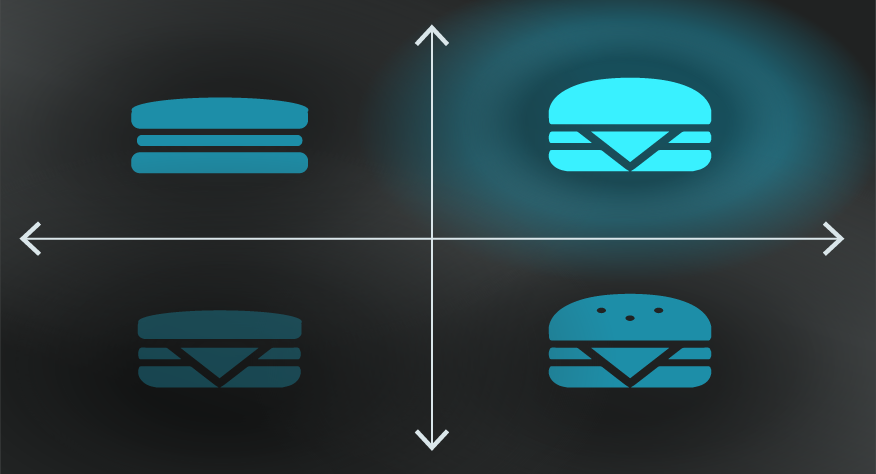
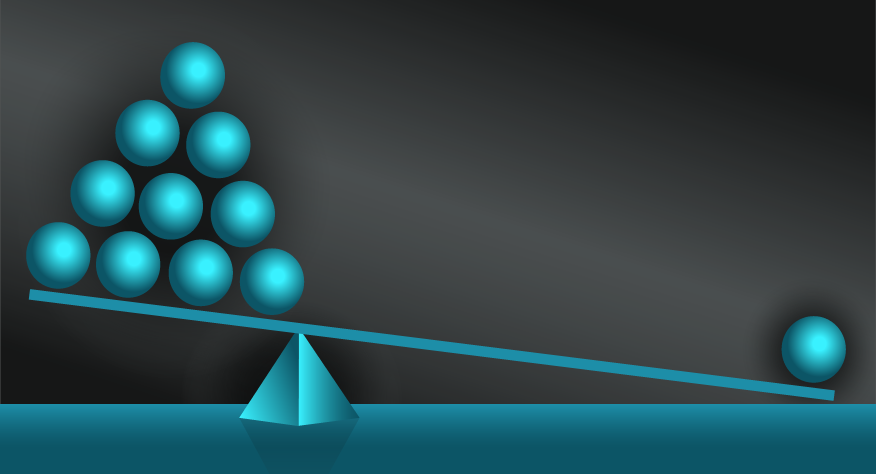
Finally, there is no clear prioritisation within the diagram — all causes seem equal, when in reality a sub cause, which is visually small, might be the key issue. Other causes and sub causes therefore might become a distraction.
Internal damages at IKEA.
This paper from Ikea in Portugal describes a process improvement process to address the level of internal damages in Ikea stores. The diagram below was part of a broader analysis process.

The fishbone or Ishikawa diagram, also known as the cause-and-effect diagram, is a core tool within quality management and is commonly used for improvements in products, manufacturing and other fields.
Use the following examples of connected and complementary models to weave the fishbone diagram into your broader latticework of mental models. Alternatively, discover your own connections by exploring the category list above.
Connected models:
- 5 Whys: in digging to root cause, use this as part of the fishbone process.
- Second order thinking: to go beyond the initial cause to sub causes.
- 4Ps of marketing: as possible categories.
Complementary models:
- Risk matrix: to consider potential issues with consequences versus likelihood.
- Chain reaction/ domino effect: to consider the flow on effects of potential issues.
- First principle thinking: to identify and go below assumptions.
- Occam’s razor: to cut to the core of the issue.
- Divide and conquer: separating out and addressing potential causes.
The Fishbone Diagram was created by quality management pioneer Professor Kaoru Ishikawa in 1968. Ishikawa, an engineer, was a leader of quality management at Kawasaki at the time. In his 1986 book, Guide to Quality Control, Ishikawa argued that there were six other key quality tools in addition to what he called the ‘cause-and-effect diagram’, which were: control chart, histogram, flow chart, run chart, scatter diagram and Pareto chart.
 My Notes
Oops, That’s Members’ Only!
Fortunately, it only costs US$5/month to Join ModelThinkers and access everything so that you can rapidly discover, learn, and apply the world’s most powerful ideas.
ModelThinkers membership at a glance:

“Yeah, we hate pop ups too. But we wanted to let you know that, with ModelThinkers, we’re making it easier for you to adapt, innovate and create value. We hope you’ll join us and the growing community of ModelThinkers today.”
You Might Also Like:
- Actionable summaries of the world's most powerful ideas.


Subscribe now and download this practical guide to transform your thinking, plus recieve one short, powerful and actionable idea in your inbox each month.